New Listings and Pending Sales
612-840-0819

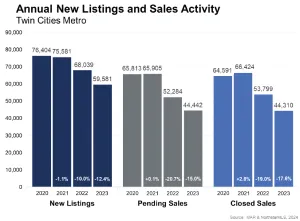
Minneapolis–Saint Paul, Minnesota (January 29, 2024) – After sales reached a 20-year high in 2021, sales in 2023 plunged to their lowest level since 2011. The pendulum always overswings. That decline can mostly be tied to higher interest rates along with rising prices and a shortage of housing supply. Mortgage rates rose nearly three-fold between 2021 and 2023—from 2.7% to 8.0%, and yet our region still saw record sales prices, although the pace of those gains has slowed.
2023: A Year in Review
Home sales fell for a second year in a row, according to an annual report issued by Minneapolis Area REALTORS® and the St. Paul Area Association of REALTORS®. Would-be buyers have been discouraged by a triple punch of higher mortgage rates, rising prices and low inventory. Yet, even weaker demand wasn’t enough to pressure prices lower because of the lack of available homes for sale. That meant sellers still saw reasonable offers relatively quickly—but not to the same degree as in 2021 and 2022. Aside from sales volume, in some ways, 2023 represented a return to a more normal, pre-COVID market.
While multiple offer situations are still happening but have become less common, waiving inspections and similar tactics have become rarer. Overall, buyers were more cautious and selective throughout the year. Sellers, however, felt the “lock-in” effect where they were reluctant to relinquish their favorable mortgage rates and trade up for a higher rate on a higher priced home. And, as we know, most sellers have to turn right around and be buyers, which partly explains why the largest share of buyers since 2013 chose to leverage their equity from their last home and purchase the next in cash as opposed to contending with higher mortgage rates.
“During the year, we saw many similar trends from the second half of 2022 where higher rates began to weigh heavier on the marketplace,” said Amy Peterson, President of the Saint Paul Area Association of REALTORS®. “We saw fewer listings and fewer sales; and yet higher prices, surprisingly strong offers and relatively quick market times.”
Rate Hikes and Short Supply
The rate hikes meant less activity, but the supply shortage meant decent offers, rising prices and homes selling in a reasonable time frame—albeit longer than the previous two years. Mortgage rates are too high for prices to rise significantly, but supply is too tight for prices to fall. There’s less activity overall but the balance between that buyer and seller activity remains tight. There will always be job, family or health changes that necessitate a home sale or purchase. That’s still happening, but some buyers who wanted to move at a 3.0 or 4.0% rate but don’t have to are choosing to stay put. The Federal Reserve has signaled there’s a good chance rates come down in 2024 in response to inflation cooling, but no guarantees. It would be a welcomed reprieve for frustrated buyers.
“Given the ever-changing nature of real estate, patience, persistence, creativity around financing, and managing expectations are key ingredients to a successful transaction,” said Jamar Hardy, President of Minneapolis Area REALTORS®. “If rates do come down, a lot of pent-up demand that’s been sidelined recently will be unleashed which could lead to another frenzied market with listings selling for over asking price. Whatever happens, it’s critical to work with a qualified market expert to navigate these complexities.”
Impact of Higher Mortgage Rates
Ultimately, residential real estate mostly boils down to monthly payments. That’s where affordability comes in. Relatively few homebuyers pay cash; most take out a mortgage with monthly payments. In that sense, monthly payments matter more than price. In fact, if you downsized to a less costly home last year there’s a chance your payments still rose. Enough well-paying jobs are key to sustaining the monthly payments, upkeep of and demand for homes. That’s why in the short term, rates matter. But in the long run, it’s the economy and labor market that determine the long-term health and sustainability of the housing market.
Since 2020, the typical payment on the median priced home has risen from around $1,600 per month to $2,700 per month. Even as income growth has accelerated over the last few years, that jump is too large a hurdle for too many Minnesotans. Committing a larger share of a household budget to housing also means less discretionary spending elsewhere in the economy, which is a key contributor to economic and job growth. Housing affects the economy, and the economy affects housing.
The impact of higher rates has rippled throughout virtually every corner of the marketplace. Compared to 2022, homes are taking longer to sell (40 vs. 31 days), sellers are accepting less of their asking price (99.3% vs. 100.9%) and absorption rates have risen (1.9 months vs. 1.5). But because the last several years were so unique, it’s worth comparing 2023 to 2019. When compared to 2019, home sales in 2023 were down 26.0% and new listings shrank 21.8%. While market times were up compared to 2022, homes sold more quickly than in 2019 and 2020. Although sellers received on average 99.3% of their list price for the year, they accepted 96.6% in December.
Market Activity by Region
“The [Twin] Cities are wonderful, but we also have an entire state that offers all sorts of different homeownership opportunities,” according to Geri Theis, President of Minnesota Realtors®. “Greater Minnesota offers something for everyone. But too many felt excluded from homeownership due to affordability challenges and we must continue working to change that.” Rural broadband, affordable childcare, education and a labor shortage remain thorny obstacles. “While it was undeniably a challenging year for buyers, over 60,000 Minnesotans were able to close on a home across our great state,” Theis continued.
Market activity always varies by geography, price point and market segment. For example, a large $600,000 single family home in Eden Prairie doesn’t affect a Duluth condo selling for $195,000 or a Brainerd cabin selling for $350,000. And with the rise of remote work, many Minnesotans can telecommute from outside the metro and reside on a lake in a more rural area, for example.
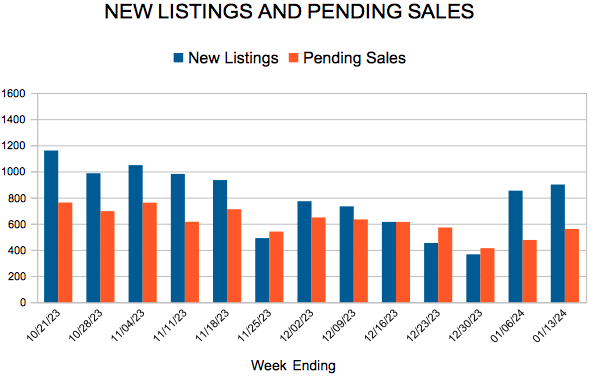
December pending sales—a measure of future demand—rose 8.7% statewide compared to a 3.7% increase in the metro. Home prices rose 3.3% for the month statewide versus 1.1% in just the Twin Cities. Both the metro and the state have below average unemployment rates and above average incomes. Challenges persist, but Minnesota seems well positioned. As inflation continues to cool and the economy remains stable, the rate environment should ease. That could incentivize more demand that would still be faced with a shortage of supply. It should make for an interesting year.
2023 by the Numbers | Compared to 2022

Tight supply and record demand pushed prices higher, market times lower and sapped inventory
Minneapolis–Saint Paul, Minnesota (January 24, 2022) – In 2021, housing demand reached a 20-year high while the number of homes for sale hit a 20-year low, according to an annual report issued by Minneapolis Area REALTORS® and the St. Paul Area Association of REALTORS®. That dynamic has been driving virtually every other housing indicator. For sellers, the year brought record prices, blazing fast market times, offers over asking price and a thin market where their homes stood out.“While the year was undeniably strong, we did see sales activity slow and price gains moderate in the second half of the year,” said Mark Mason, President of the Saint Paul Area Association of REALTORS®. “Ten percent price growth or higher simply isn’t sustainable long term. But we do expect the landscape to remain competitive in 2022 after not knowing what to expect the last couple years.”
For buyers, motivation from historically low mortgage rates, a desire for more space for remote work and learning, and an economy recovering from the pandemic crashed right into the supply shortage. These factors have caused some buyer fatigue and raised affordability concerns. The supply-demand imbalance has created a competitive environment where multiple offers are commonplace.
“Some aspiring buyers grew frustrated with a market favoring sellers. I worked with several buyers who wrote upwards of five offers but we kept losing out, particularly in the more affordable segments,” said Denise Mazone, President of the Minneapolis Area REALTORS®. “The [housing] shortage is so persistent. We need about five to six times our current inventory levels just to reach a balanced market. That said, these low mortgage rates have partly offset the effect of rising prices on monthly payments.”
While single family homes make up most of our market, sales of townhomes and condos rose ten times as fast. Labor constraints and supply chain disruptions meant builders listed fewer—and buyers closed on fewer—newly built homes than in 2020. Despite some concerns around forbearances, lender-mediated activity (foreclosures and short sales) declined significantly from already low levels to about half a percent of all sales. 30-year fixed rates started the year at 2.65 percent and ended at 3.1 percent, though they’ve already touched 3.45 percent in 2022 given rising inflation. That could dampen demand in 2022 and restrain price growth which, if combined with an increase in listings, may start to impact market balance. We’ve been in a seller’s market for 10 straight years; perhaps a shift in the power balance is just what disheartened buyers need.
2021 by the Numbers Compared to 2020
Charting the Market
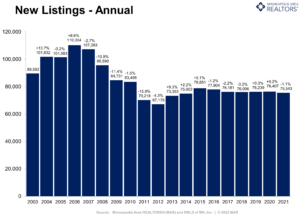 Seller activity (new listings) was down slightly from 2020 and reached its lowest level since 2014 despite record sales. Some drivers include hesitance around showings during a pandemic, having no place to go, refinancing to a lower rate, weak new construction activity and Baby Boomers aging in place instead of listing their homes. Disheartened buyers have been thirsty for more inventory for years.
Housing demand has rocketed higher over the last two years. Buyers were motivated by a desire for more space to work and learn from home, historically low interest rates, more options due to remote work and maybe even a fear of missing out. The condo and luxury $1M+ sub-markets outperformed other market segments. Sales would’ve undoubtedly been higher if we had sufficient supply.
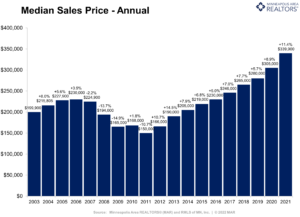 With supply at a 20-year low and demand at a 20-year high, it’s no surprise the median sales price rose to set a new record. Home prices have risen 126.6% from their low point in 2011 and 47.8% from their prior 2006 peak. Rising prices boost equity and theoretically should motivate some reluctant sellers. But it also gives rise to affordability challenges.
Inventory levels declined almost every year since 2007, bringing housing supply levels down 84.4% from their peak. On average, buyers had 6,800 options during the year and nearly 9,000 in September. This supply-side constraint has led to bidding wars and rising prices. The shortage has frustrated some buyers—particularly at the entry-level price points. More supply is vital to market health and to increase housing opportunities.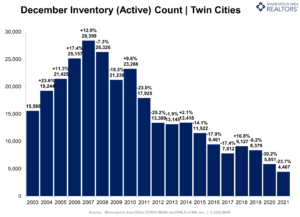
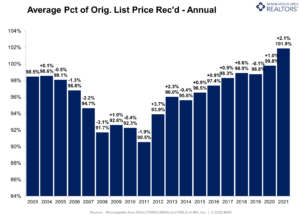 Multiple offers—often above asking price—has allowed sellers to yield 101.9% of their asking price. That varied by area, property type and price point. Sellers find that listings stand out in an undersupplied market. Proper pricing was still important for motivated sellers. But a historic high for this ratio of sold to list price reflects highly motivated buyers as well as the imbalance between supply and demand.
Homes are selling at the fastest pace on record. Between May and July, half the homes sold in under a week, but more like 11 days for the year. That’s down 90.5% from 2008. Here again the inventory shortage and historic demand meant buyers pounce on attractive listings right away. Homes didn’t linger on the market for long. Even so, more homes selling in record time and at record prices couldn’t entice more sellers onto the dance floor.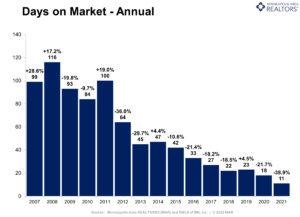

Greet me and meet me on social media. You can follow my new listings and changes in the marketplace on any of the following. Follow me.