New Listings and Pending Sales
612-840-0819


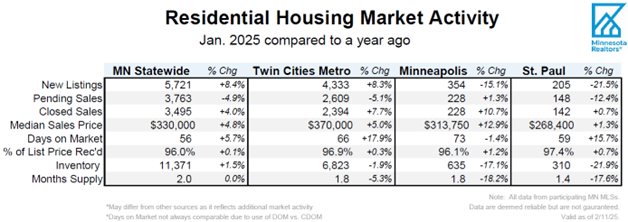
(Feb. 18, 2025) – According to new data from the Minnesota state and Twin Cities metro Realtor® Associations, seller activity and home prices rose across the state and metro in January, but new buyer activity was lower.
Sellers, Buyers and Housing Supply
An inventory shortage and lack of affordability brought on by higher mortgage rates remain central themes. Mortgage rates averaged just about 7.0% throughout January—the highest level since May 2024. That pushed buyer activity lower across the state and metro, breaking a three-month streak of gains in pending sales for the state, and a four-month streak of gains for the metro. And that was just as buyers seemed to be adjusting to higher rates in recent months. Compared to last January, seller activity was up over 8.0% across both the state and metro; pending sales were down about 5.0% for both the state and metro. Sellers—whether move-uppers or downsizers—are having an easier time in this market if they can break the shackles of their low interest rate. They have plenty of equity from their last home, which has risen in value considerably over the last few years. But those sellers will find less inventory and fewer options this January than last. That said, the latest numbers show that every month of 2024 actually had more inventory than the year prior.
Many other would-be sellers still feel wed to their homes with rates as low as 2.7–4.5%, compared to 7.0% today. This lock-in effect has caused a buildup in “pent-up demand” to sell and buy, meaning as rates fall, competition will stiffen up. There are signs of recovery, but affordability remains a major hurdle. Prospective buyers are still feeling the triple punch of higher prices, higher mortgage rates, and limited inventory.
“First time buyers face the biggest hurdle while other shoppers and sellers aren’t feeling the pinch quite as much,” said Patti Jo Fitzpatrick, President of Minnesota Realtors®®. “Today’s buyers can be more patient and selective because they have more choices, but that could change as we approach the spring. The year is young.”
Prices, Market Times and Negotiations
Every area, price point, and market segment is unique. Some listings are getting multiple offers in a few days and closing for over list price, while others are being discounted or lingering on the market. On average, however, sellers accepted offers at 96.0% of list price statewide and 96.9% in the metro—both up from last year and both at their highest January level since 2022. Those offers were accepted after an average of 56 days on market statewide and 66 days in the metro—both figures up from a year ago.
“Despite some weakness in January, it feels like things are starting to change. But it’s difficult to speak to the entire metro market,” said Frank D’Angelo, President of Minneapolis Area Realtors®®. “Even downtown, prices in the Downtown East Mill District were $1.2M but then 10 blocks away Loring Park condos were selling for around $170,000.”
The statewide median home price was up 4.8% to $330,000, while the metro median price was up 5.0% to $370,000. But home prices seem to matter less than monthly payments. In fact, a typical “all-in” payment on the median priced home, including taxes and insurance, is about $2,500 statewide and $2,800 in the metro. Compare that to an $1,800 metro mortgage payment in 2021. More housing supply means less upward price pressure while a strong economy creates well-paying jobs for residents to sustain those monthly payments and keep up with repairs and maintenance.
“Despite a dip in sales, I’m still hearing more optimism these days. There’s a sense that things are slowly rebalancing,” said Jennifer Livingston, President of the Saint Paul Area Association of Realtors®®. “For better or worse, interest rates continue to drive this market. I have prospective buyers who are literally watching the rate changes day to day. Today’s buyers are very rate sensitive.”
Locational Differences | Minnesota Statewide
Market activity always varies by area, price point and property type. Regions such as Duluth and the North Shore, Rochester and Willmar saw the largest gains in seller activity. Alexandria, Willmar and Brainerd had the largest gains in pending sales. Homes sold the fastest in the Duluth/North Shore region along with St. Cloud and Rochester. Prices were highest in the metro followed by Detroit Lakes, Alexandria and Rochester. The most affordable regions of the state were Hibbing/Virginia, Willmar and Grand Rapids. Every region is undersupplied except Hibbing/Virginia, which is a balanced market.
Locational Differences | Twin Cities Metro
For cities with at least five sales, Mahtomedi, Mendota Heights and Oak Grove had the largest sales gains. The highest priced areas were Deephaven, Sunfish Lake, Independence and Tonka Bay while the most affordable areas were Little Canada, Osseo and Circle Pines. But the largest increases in prices were in Deephaven, Medina and Mendota Heights. The most oversupplied markets were Centerville, Hanover and Delano while the most undersupplied markets were Circle Pines, Mounds View and New Brighton. Homes took the longest to sell in Shorewood, Medina and White Bear Township and sold the fastest in St. Paul Park, Norwood Young America and Wyoming.


Buyers overcame triple punch of higher rates, rising prices and tight inventory for slight gain on the year
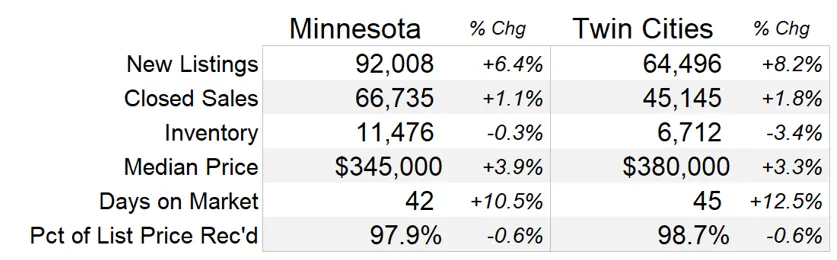
Minneapolis–Saint Paul, Minnesota (January 28, 2025) – Home sales increased in 2024, according to new annual reports issued by Minnesota Realtors® (MNR), Minneapolis Area REALTORS® (MAR) and the St. Paul Area Association of REALTORS® (SPAAR). It’s been a challenging few years for aspiring home buyers. Hindered by a thorny trifecta of rising prices, higher mortgage rates and a shortage of homes, it’s no secret today’s home buyers are feeling the squeeze. That’s what makes an increase in sales stand out given the impediments. Despite the headwinds, buyers were persistent and hopeful for future refinancing opportunities. Home sales rose 1.1% statewide and 1.8% in the Twin Cities metro, both compared to 2023. But that slight gain was off of a low baseline. While it’s impossible to say with certainty, 2023 could be the bottom for sales this cycle.
Seller activity also rose, as sellers had an easier time moving up than first-time buyers had moving in. Despite activity gains, sellers still felt the “lock-in” effect in that they were reluctant to relinquish their favorable mortgage rates and trade up for a higher rate on a pricier home. Diplomas, diamonds, diapers, divorce and death are common reasons sellers simply couldn’t wait any longer. New listings were up 6.4% statewide and 8.2% in the metro. Most sellers are also buyers, but second time or move-up buyers had the luxury of bringing the equity from their last property. Speaking of luxury, sales of homes priced over $1M in the metro rose 12.3% to their highest level on record—roughly four times the 2005 level. Luxury buyers aren’t rate-sensitive like first-time buyers, and so the luxury segment has continued to outperform despite the higher rate environment. Sales under $300,000 fell 8.5%. About 17.5% of metro sales were purchased in cash and not financed––the highest level since 2013. And that figure is about double for homes over $1M.
There were some key differences between market segments. For example, in the Twin Cities:
Prices also rose but so did market times. The median sales price was up 3.9% to $345,000 statewide and rose 3.3% to $380,000 in the metro. Mortgage rates are too high for prices to rise significantly, but supply is too tight for prices to fall. There’s less activity overall but the balance between buyer and seller activity (i.e. supply and demand) remains tight. Since 2020, home prices are up 25.5% statewide and 24.6% for the metro. Days on market rose 10.5% to 42 days statewide and increased 12.5% to 45 days in the metro. Although sellers needed to exercise more patience, due to three consecutive years of longer market times, homes continued to sell as quickly—or even faster—than in 2019 across both the state and metro areas. “Sellers did have to be more patient, but not overly so, as they were still in a relatively favorable position. Buyers who wrote strong, clean offers right out of the gate tended to be successful,” said Jennifer Livingston, President of SPAAR.
Inventory levels were technically lower as of year-end but were actually higher than 2023 for much of the year. The number of homes for sale statewide fell 0.3% to 11,476 and fell 3.4% to 6,712 for the metro. Even with the inventory increases in 2022 and 2023, there are still fewer homes for sale now than in 2019 for both the state and metro. “Motivated buyers did see more choices during much of the year, but were more cautious and selective during their search,” said Patti Jo Fitzpatrick, President of MNR. “Believe it or not, some sellers still received multiple offers on attractive and well-priced listings,” she added. In order to achieve a balanced market where neither side has the upper hand, we’d need to more than double our inventory of homes for sale. Finishing the year with just 2.1 months of supply statewide and 1.8 months in the metro—both down from 2023 but back up to 2018 and 2019 levels—highlights the ongoing supply shortage despite declines in demand. A balanced market should have around five to six months of supply. That leads to historically average price growth, market times and negotiations, instead of sellers holding the reigns as they have lately.
Sellers received 97.9% of their list price statewide and 98.7% in the metro, both down slightly from last year. In this slightly less competitive market, sellers were willing to accept a bit less of their asking price. Higher rates have meant less activity lately, but the supply shortage meant sellers still received appealing offers in a reasonable time frame. In the Twin Cities, single family home sellers accepted offers at 99.0% of their list price while condo sellers accepted 96.1% of their list price. Three-bedroom homes between 1,500 and 2,000 square feet tended to perform the best here. Homes under $500,000 fetched 98.8% of their asking price while the figure was 96.7% for homes over $1M.
Housing affordability has certainly suffered recently. In some ways, payments matter more than prices to home buyers. And that monthly mortgage payment has risen by about $1,000 per month since 2020. Although prices have been up about 25.0% since then, monthly payments rose roughly 72.0% over the same period. Assuming 10% down, the typical payment on the median priced home in Minnesota rose from $1,450 in 2020 to $2,500 in 2024. Even downsizers purchasing a less expensive home could easily see higher payments. That has stretched budgets and partly reflects rising prices but is mostly driven by higher mortgage rates. According to Freddie Mac, the average 30-year mortgage rate in 2024 was 6.7%, down a hair from 6.8% in 2023. But the range was more like 6.1% to 7.1% throughout the year and monthly sales activity echoed that, suggesting buyers are still quite rate sensitive. “Buyers not only saw rates vary throughout the year but also noticed that inventory growth as well,” said Frank D’Angelo, President of MAR. “If rates continue to cool down toward the low sixes or even high fives, I think that would really get buyers off the bench. But we still don’t have enough homes for sale.” Even a 6.0% rate would be a welcome reprieve for frustrated buyers. Though inflation has cooled notably, the Federal Reserve has signaled a slower pace for rate cuts.
“Real estate is cyclical and can change quickly. Patience, persistence, and creativity around terms and financing options as well as managing expectations are keys to a successful transaction,” said Patti Jo Fitzpatrick, MNR President. “There is a lot of pent-up demand to list and buy that’s been held back. If rates come down too quickly, that could lead to another overheated market where multiple offers are the norm and buyers are taking on more risk. Whatever the case, it’s critical to work with a Realtor® to navigate today’s complex market.”
In the near term, rates matter. But in the long term, it’s really the economy and labor market that determine the health and sustainability of the housing market. Attracting and maintaining enough stable, well-paying jobs is essential to sustaining the monthly payments on, upkeep of and demand for residential property. We’re pretty fortunate here in Minnesota. Our incomes, homeownership rates, educational attainment, Fortune 500 companies, life expectancy, voter turnout and bicycle ridership are above average while our home prices and unemployment rate are below average. At about 4.0% per the Bureau of Labor Statistics, wage growth in Minnesota is currently outpacing inflation (CPI up 2.7%) and keeping up with home prices (up 3.9%). Even so, dedicating a larger share of a household budget toward housing also means less discretionary spending elsewhere in the economy, which is a crucial contributor to economic and job growth. Housing affects the economy and the economy affects housing. There are growing challenges around taxes, regulation and rising insurance costs. Affordable childcare, the racial homeownership gap, rural broadband and an ongoing labor shortage are also prickly obstacles. Despite these challenges, Minnesota is well positioned for continued success moving forward.
2024 by the Numbers | Compared to 2023
2024 Charted | Comparing the last three years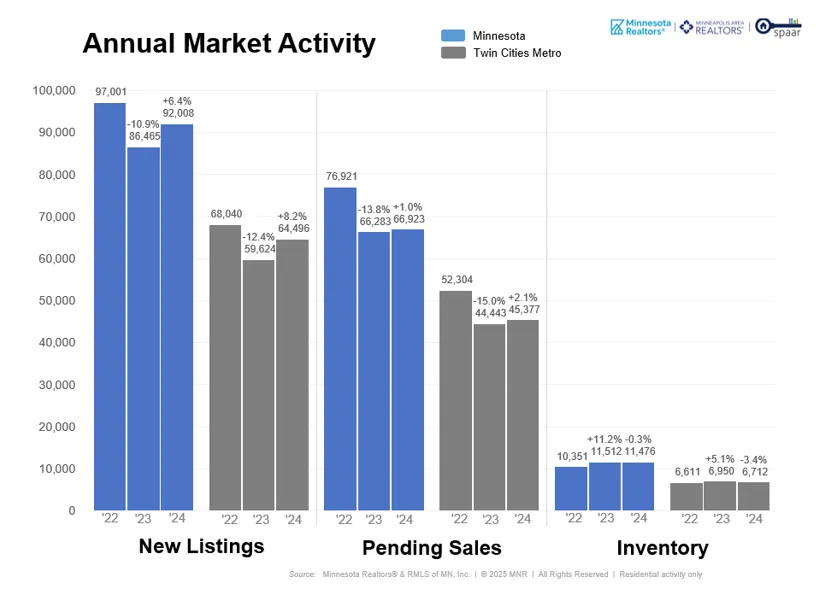
All information is according to the Minnesota, Minneapolis and St. Paul REALTOR® associations and based on data from NorthstarMLS. We serve agents across the state and Twin Cities metro area as well as western Wisconsin. For other year-end residential real estate information and for stand-alone December 2024 data, please visit www.mnrealtor.com, www.mplsrealtor.com and www.spaar.com.


Greet me and meet me on social media. You can follow my new listings and changes in the marketplace on any of the following. Follow me.